We all know a lot has changed on the internet in the past five years. I, like many of you, have been reluctant to adopt Google analytics 4 because why fix something that’s not broken?
Well, the time has finally come to embrace change with confidence that the all-knowing Google knows what they are doing.
Here are the top four GA4 modifications that I find most intriguing. I’ll demonstrate the changes they made along with their rationale.
This will help you start a goal-oriented conversation with your clients!
It’s called the future baby and WE’RE IN IT.
No more “views” – now we have “data streams”
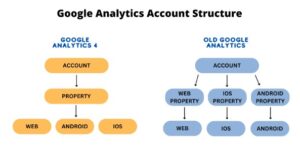
In the old analytics, you had to create a property for each data source. As a result, IOS had to exist in distinct properties from Android or website data.
Therefore, it wasn’t as easy to see all of your cross-platform data.
Now, GA4 allows you to ROLL-UP all your app and website engagements into one property or DATA STREAM. The information that feeds into your Google Analytics property comes from data streams. You may compare and aggregate user behavior across many platforms by having a data stream for your website, Android app, and iOS app.
For businesses that operate apps or have many domains, this is crucial.
This will help you differentiate behavior across all of your brands’ platforms.
So long behavior metrics
I know it’s kind of a tough one to swallow. No more average session duration, bounce rate, and page views?
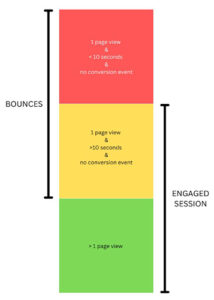
Actually all that is still around, but now it’s called an “engagement session”.
That is when a user stays in a session that is longer than ten seconds or contains a conversion.
So an “engagement rate” is how often that happens.
It sounds crazy; how would they get rid of the bounce rate metric? But measuring user behavior like this instead of the bounce rate makes more sense going forward.
The bounce rate shows a negative action, while the engagement rate is the exact opposite. Did the user engage or not? So just look at it like this.
If you have a 77% engagement rate, then your bounce rate is 33%.
All of your new engagement rate metrics will be categorized under “Page Value”.
Dig Deeper
Automating With Programmatic Advertising
After The Traffic – What To Do To Ensure Conversion
Hello events
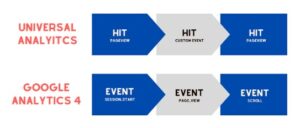
Events include all activities that take place on your properties. Now that everything is visible, you can measure user behavior holistically.
The old metrics didn’t really make sense for mobile app actions because they significantly differ from website actions, such as “page views,” which is why “events” were invented.
There are four types of events.
- Auto-collected events – This comes built-in. Easy things like ”session starts”, “session length” and a few more.
- Enhanced measurement events – These include scroll depth, first visit, and so on; these require Google Tag Manager, but they can be recorded with ga4-js out of the box. All you have to do is install the tag manager pixel on your site and it will automatically start gathering these events.
- Recommended events—events that you need to set up yourself in tag manager—but Google already gives you the idea, so just go make them in tag manager.
- Custom event – Customized granular reporting (the ball’s in your court).
You must plan for the reports you want
The old analytics came with a ton of out-of-the-box reports. In GA4 there are many fewer reports – that’s because GA4 is built more to collect data efficiently and then really export the data into making your own funnel reports and the data that is important to you.
It’s less of a reporting interface and more of a platform that gives you the do-it-yourself tools to make your own reports.
It means you need to put a bit more thought into setting up your jeans properly.
Proper planning is crucial for Google Analytics 4.
Every organization is different, you might wish to track various aspects to learn how certain components function. And one of the ways you may alter it is by giving it unique dimensions. With Custom Dimension you can go in-depth with your setup rather than just having a few generic pieces of data.
This is very helpful for building your customer acquisition journey.
Conclusion
Google Analytics 4 gives us a fresh perspective on data. It’s a simplified model and allows for more granular reporting. There are so many more exciting things to talk about with GA4 like machine learning and user privacy, but use these four talking points to start a good, goal-oriented conversation.